|
Chart
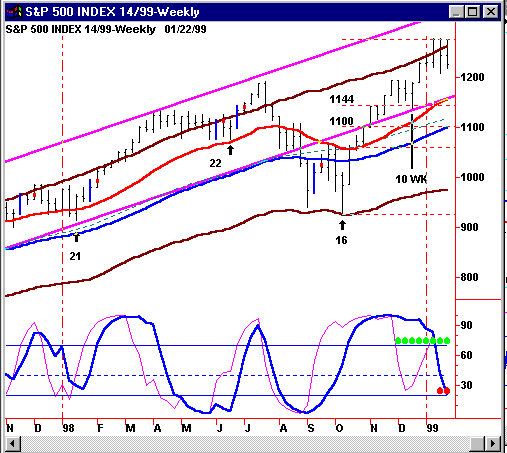
1 - The 20-week cycle bottoms are indicated by the up arrows. The
uptrend continues as indicated by the red EMA being above the blue and
expanding, following the drop into the 4-year cycle bottom that occurred
with a 16-week cycle bottom testing the lower Keltner Band. The 20-week
cycle has topped within the green timing band, and prices are likely to
find support near the 38% retracement at 1144, and the lower purple channel
line which is confluent with the red EMA line.
Go
to Chart 2
|
|
Chart
2 - This shows a clearer picture of the previous chart. The blue 10-double
stoc is at the 20 level and likely to drop lower over the next week or
two as the 20-week cycle bottoms, probably above the 38% retracement level
at 1144. Notice how the red EMA is clearly expanding above the blue EMA,
an indicator of a strong uptrend, and higher prices following the bottom
of the 20 week cycle. The red EMA is likely to flatten a bit as prices
drop into the 20-week cycle bottom.
|
