Walter Bressert Futures OnLine
ProfitTrader™ Trend Channel Indicator

ProfitTrader™ TREND CHANNEL
Standard deviation based Trend Channels are designed to show the trading trend. Yellow Trend Channels are plotted in rising markets; red, in declining trends.

Go to Chart with Audio presentation.


To begin:

  • Click on the Audio link below to activate the audio chart commentary. A Real Audio Player is required for the audio files. If you do not have a Real Audio Player, click here for information on downloading a free Player.
  • Effective 12/18, we have added a Q&A feature to this presentation. To post a question on this indicator for Walter to answer, and to view previous Q&A sessions, click Q&A Session. (You will be prompted to sign our guest register to participate in this part of the presentation if you have not already done so.)
  • Click Next to go to next page in the presentation.

NOTE: Before clicking on the "audio" link, allow the chart to fully load. If the charts do not download completely, right mouse click and choose "refresh".


Real Server Audio (default that appears at top of chart) to access the audio file from our RealAudio server; or

Download Audio to download audio file onto your hard drive. This option takes several minutes to download, but if you don't have a lot of bandwidth with your ISP, the audio file will play better.
 

Audio - Q&A Sesson - Next
 
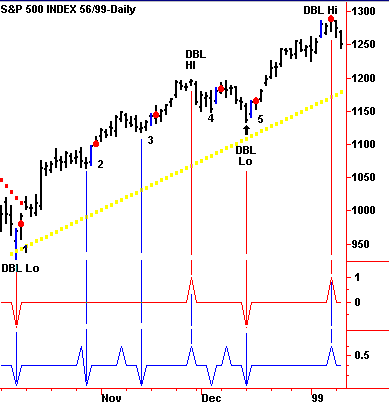
Chart 11 - Trend Channel - The yellow Trend Channel shows the trend is up, indicating only mechanical buy signals should be taken.
 

Chart 11 illustrates the use of the Trend Channel with the Cycle ID indicators and Bressert Double Stochastic mechanical buy signals. Cycle bottom #1 has a DBL Lo as both the longer-term, red Cycle ID and shorter-term, blue Cycle ID show a bottom simultaneously.

Although you cannot see it on the chart, this low followed an extended decline. The trend at the time was down as indicated by the red dots above prices, but the DBL Lo indicated a potential bottom and trend reversal. As prices started rising, the yellow Trend Channel line began to plot. Bottom #2 showed only on the blue short-term Cycle ID, but a cycle bottom was indicated by the blue setup entry bar, and this low could have been bought by an aggressive trader. Bottom #3 is also buyable in that the Trend Channel was up and the blue Cycle ID showed a potential cycle bottom that was confirmed by the blue setup bar and trigger entry. Prices moved up from bottom #3 to make a longer-term cycle top indicated by the DBL Hi in both the red and blue Cycle IDs. Prices then moved down into bottom #4 indicated as a low only by the red Cycle ID valley. Since this buy signal followed a DBL Hi it would not be taken. However, the sell signal that followed in the blue Cycle ID could have been taken, but since the Trend Channel was moving up, the sell signal would normally be passed over.

Bottom #5 is a great buy. It is a DBL Lo indicating a significant bottom. Prices dropped below bottom #4, moved down towards the Trend Channel but did not penetrate it, and turned up to show a bottom as the blue setup bar formed. The rise above the blue setup bar at bottom #5 triggered a buy entry and a DBL Lo. This DBL Lo saw a relatively small retracement of the move from bottom #1 to the DBL Hi indicating the potential for a sizeable upmove.

In trading with cycles, the dollar risk for a long position is generally from entry to cycle bottom with the protective sell stop placed below the cycle bottom. This was a low dollar risk trade that was followed by a substantial upmove to the next cycle top indicated by the DBL Hi. It was the Trend Channel that provided the trend overview to buy bottoms 2, 3 and 5.


Next: Keltner Bands shows cycle tops and bottoms earlier than oscillator turns.

Previous: EMA Trend Indicator


Back to Top
Back to Index

Walter Bressert, Inc.
Post Office Box 4088, Vero Beach FL 32964
Voice: (561) 567.1101

Mailto:[email protected]

There is a risk in trading futures.
If you encounter a problem on our site, please notify webmaster.

Copyright © 1999 Walter Bressert, Inc. All Rights Reserved.

 
Q&A Session for the Trend Channel Indicator

To view previous Q&A; sessions, click on the question(s) of choice below. To post a question on this indicator for Walter to answer, click Submit Question.

You will be prompted to sign our Guest Register to view this part of the presentation if you have not already done so.


Posted by: Mike Kraft, , , on 04/26/2000
When you reference the "longer-term Cycle ID", would this be a cycle ID at 2 to 3 times the normal cycle strength or a Cycle ID from a longer term chart?