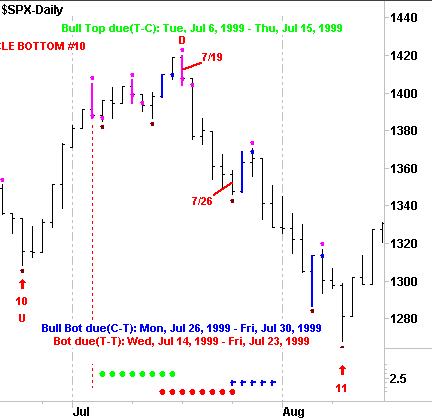
The seasonal cycle is now moving down, with the expectation for a decline into the fall seasonal bottom. A bear, (left leaning and below the previous cycle high) trough-to-crest high is forecast to occur Wednesday, 9/8, thru Monday, 9/13.
Coming out of Cycle Bottom 12, the market makes a swing top at D, indicated by the purple dot, drops to make a swing low indicated by the dark red dot, then rallies up to make a lower swing high indicated by the second purple dot. This second high occurred within the Timing Band, and is a swing failure pattern indicating a probable cycle high at D. This pattern can be sold either as prices take out the low of 9/10 as at #1, or as prices drop below the swing low indicated by #2. Either way, there is a sell signal into a cycle bottom due 9/22 thru 10/1, and the trading cycle bottom occurred on 9/28.
The Timing Band Forecaster is as accurate in forecasting cycle tops and bottoms for intraday time frames as short as one minute chart. Whatever time periods you trade, you can improve your timing with The WB Timing Forecaster.
Walter
Bressert OnLine
Mailto:[email protected]
There is a risk in trading futures.
If you encounter a problem on our site, please notify webmaster.
Copyright © 1998-2003 Walter Bressert, Inc. All Rights Reserved.