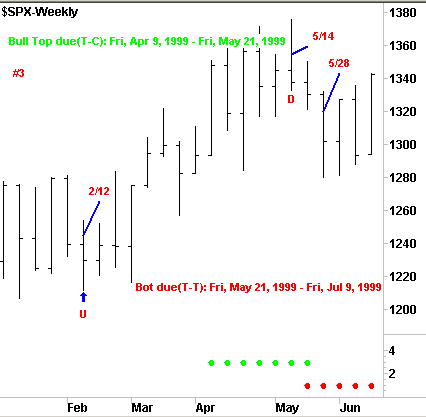
From the 2/12 bottom in Chart 2, the same low is shown in Chart 3.
From this low, the Timing Band forecast was for a bull top, meaning the market is expected to have right translation, and move higher than the previous cycle high, to occur the week of 4/9 thru 5/21. The green dots at the bottom of the chart show the Timing Band. The cycle high occurred the week of 5/14 within the 40% Timing Band. The forecast for the next cycle bottom made when the 2/12 low was confirmed was for the next low to occur the week of 5/21 thru 7/9. The price low actually occurred on 5/28 within the red Timing Band at the bottom of the chart. are indicated by the blue up arrows.
Walter
Bressert OnLine
Mailto:[email protected]
There is a risk in trading futures.
If you encounter a problem on our site, please notify webmaster.
Copyright © 1998-2003 Walter Bressert, Inc. All Rights Reserved.